With a tiny gadget following our every command without any slippage, we all can call our mobile phone as a “genie in a bottle” that obliges almost all our whims. Technology has superseded our expectations but enabling highly extensive customer-centric experiences that makes it impossible for us to be without our phones at anytime of the day. A fun thing to know about mobile app statistics: on average, a consumer spends 3.7 hours on their mobile phone per day.
A whopping number of 204 billion apps were downloaded in 2019. It’s not just about downloading a mobile app but also using it. On average, a person may have 80 odd apps installed on their phone but out of these mobile apps, they are probably around 9 that they use on a daily basis.
And you thought that an app can just easily reside in a user’s mobile phone? With constant emphasis on maintaining internal storage space, users usually uninstall a mobile app 30 days after downloading it if they don’t find it useful, interesting or appealing. Therefore, market retention is the biggest issue that companies face in launching their apps in the market.

Why mobile development has become popular?
The answer is one word: revenue. Companies spend a huge amount of money to launch apps that are then used by consumers. The cost of an app varies based on its features and complexity. The type of technology, and platform also are the determining factors of the total cost of mobile app.
A company can get an app built under even $5000 budget. However, some apps can cost as much $100,000 or even more. For example, the development of an iOS app is usually 10-15% more costly than an Android app. So, think over all these factors combined to develop a mobile app.
Why does a company go through all these extensive efforts? It’s only to get attention of the consumers, find ways for generating revenue and get higher ROI. This is usually done by advertisements, and/or directly selling their products/services to consumers through the mobile app.
Mobile App Statistics about Consumer Spend
A look at some of the mobile application stats pertaining to consumer spending trends reveals the following figures about smart apps.
- The highest attention toward mobile apps is pertaining to games, that make up 72% of the total app store spend.
- Call of Duty and Mario Kart Tour were the most popular game apps for 2019.
- Subscriptions in non-gaming apps fueled growth in spend, from 18% share in 2016 to 28% in 2019.
- China remains the largest market, making up 40% of global spend.
- Money expenditure on subscriptions and in-app purchases in mobile gaming and non-gaming applications has grown in the United States.
Mobile App Statistics about Smart Application Users
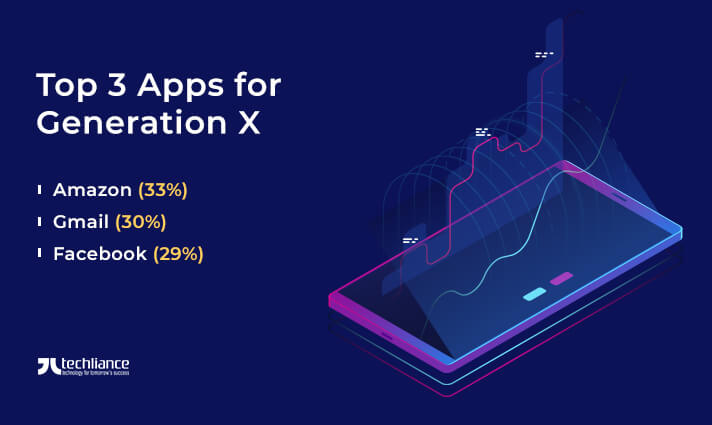
In 2020, it is expected that mobile users will be around 6.95 billion. The primary focus for mobile apps is the Generation Z (born after mid-to-late 1990s). These are the main consumer market for various types of apps including games, social networking, communication, travel and entertainment. The top 3 apps for millennials (Generation X; born between 1981 to 1996) in 2019 were as follows.
- Amazon (33%)
- Gmail (30%)
- Facebook (29%)
Forecasts for Mobile App Trends in 2020
The following technologies are geared to have greater use in the mobile apps of the 2020s.
- Internet of Things
- Augmented and Virtual Reality
- Voice Apps
- Artificial Intelligence
- Wearable Gadgets
- New Technologies Integration
Let’s explore these leading technology trends for the mobile apps of 2020s.
Internet of Things
Internet of Things (IoT) is also one such concept that will be widely embraced in 2020. Consequently, cloud-driven apps will also be an emerging factor in this year. With 83% of enterprise workloads will be on the cloud. Cisco believes that 90% of all mobile data traffic will go to these cloud-driven apps.
2020 will witness these apps to become more powerful in data retrieval. This would mean that they can instantly access data from the cloud and take up lesser space on phone’s internal memory.
Augmented and Virtual Reality
The augmented reality (AR) and virtual reality (VR) market will expand by leaps and bounds from $16.8 billion in 2019 to $160 billion in 2023. The technology is a hit with social media platforms introducing AR filters in their apps. Likewise, game developers are releasing game apps specifically for AR/VR devices.
Voice Apps
Mobile apps are developed as per the consumer demand. As a result, 34$ of marketers are expected to have a voice app by 2020. VOIP or internet calling applications like Google Voice and Line2 are popular examples. Virtual assistants like Google Assistant, Apple Siri and Amazon Alexa also also lead runners in the voice apps.
Artificial Intelligence
The artificial intelligence (AI) industry will grow to $40 billion by 2020. Much of the machine learning (ML) and AI technology incorporation will be in the mobile devices.

Wearable Gadgets
Guardian has predicted that mobiles are moving out of the pocket and becoming wearable. This means apps also need to adapt will intelligent aggregation of content. The wearable technologies will be coming up with more refined and elegant hardware for consumers. App developers will be building more apps for wearable devices – smartwatches, fitness bands, movement trackers, etc.
New Technologies Integration
Mobile apps will be integrating many of the upcoming technologies such as AI, ML, Blockchain and 5G. From 453 million wearable devices shipped in 2017, that number will increase to 929 million by 2021.
Smart applications are expected to change with varying screen sizes, faster loading, less power consumption, and seamless data transmission. The main intent is to provide mobile users with a flawless experience that leaves them wanting more.
Mobile ad spending is expected to reach $247.4 billion by the year 2020. Advertisement for smart devices has become a major form of the digital marketing. Mobile ad expenditure is projected to exceed $300 billion mark in 2021-2022.
Conclusion
Like it or not, mobile phones have an indelible impact on our lives. In 2020, the mobile app industry is expected to grow with no sign of slowing down. While the focus of the industry remains in continual improvement of the designed app and its quality; it has become more important to focus on the value provided to customers. Companies are also trying to evaluate whether the developed app is able to meet the customer expectations.

By 2023, the mobile industry is set to contribute $4.8 Trillion to global GDP. With such promising future, many companies are focusing on various new emerging technologies and integrating them with their mobile apps.
Are you thinking of getting a mobile app for your business? Your smart application can be the next hit in the mobile app statistics for the 2020s. Partner with Techliance today to be part of the buzzing market where your consumer segment is just a click away from your reach.


[…] website. Your customers are more likely to find your website through search engines even though many companies continue to spend a huge sum of money on mobile apps. A fully optimized SEO boosts the way your website is […]
[…] smartphone stats clarify that mobile apps are the primary avenue for digital interaction with businesses across all […]